MM/DD/YYYY — EST 00:00:00
STATUS: ACCEPTING NEW PROJECTS
kevin.russell@russellcontrols.com
Russell Controls — Engineering Consulting Firm
Home / Services

Customized Engineering Packages
to Fit Your Automation Needs

Russell Controls provides electrical-controls and data-acquisition engineering as five packages that can be purchased individually or combined: controls assessment, control-panel design and assembly, PLC/HMI software, turnkey controls with commissioning, and data historians.

// Pricing is scoped to your system

Five packages, purchased individually or combined — so you pay only for the scope your system needs.

// Which package fits
You need a plan, require a second opinion, or seek integration ideas
Controls Assessment
You have code and need a new panel built or an RTU
Panel Design & Assembly
You have hardware and need the logic and screens
PLC & HMI Software
You require a complete automation system designed and integrated
Turnkey Controls
You need visibility into a new or existing system
Data Historian
Included scope Not in this service Optional (on request) HW = Hardware  ·  SW = Software  ·  On-site = Commissioning
Engineering study

Controls Assessment

PACKAGE A

Know what to build before you spend the money.

  • Review of existing schematics, P&IDs, control architecture, network, and system operation.
  • Red-lined drawings and written comments on existing documentation.
  • A written recommendation: options for new integration or legacy upgrade, risks, and a plan sequenced around your outage constraints.
  • Draft acceptance criteria, so success is defined before any build is priced.
Introductory call vs. assessmentThe first conversation is free — roughly 30 minutes to understand your system, goals, and schedule. The assessment is a paid engineering engagement that produces the deliverables above.
HW SW On-site
Hardware

Control Panel Design & Assembly

PACKAGE B

A documented, factory-tested panel — ready for program download.

  • Panel design, hardware assembly, internal wiring, and controller firmware imaging in the shop; HMI mounted with firmware loaded.
  • AutoCAD Electrical drawings — power distribution, circuit protection, controller I/O, terminal blocks, relays — delivered editable.
  • Power-analysis profile of the cabinet: power quality and current load.
  • Factory acceptance test: every connection checked point-to-point against the drawings.
HW SW On-site
Software

PLC & HMI Software

PACKAGE C

Logic and operator interface, bench-verified before it ships.

  • Control design for the new system or legacy upgrade, written from the sequence of operation.
  • PLC programming: equipment control, alarms, interlocks, PID, lead/lag, and failure responses.
  • HMI screens for clear control and monitoring of the new logic.
  • Establish subsequences for faster processor scan times.
  • Multiple platforms offered: Allen-Bradley, Beckhoff, and Schneider.
  • Descriptive documentation covering all I/O, signal types, scaling techniques, and more.
HW SW On-site
Hardware + Software + On-site

Turnkey Controls & Commissioning

PACKAGE D

The complete controls scope — delivered, installed by your local trades, then tested and commissioned on-site.

  • Assessment, panel, and software, plus on-site testing and commissioning to the acceptance criteria agreed in the assessment.
  • Performed by your trades, not Russell Controls: field conduit and wiring, landing of facility power and field signals, mechanical and piping installation, and OEM equipment setup. Russell Controls issues field-wiring drawings and coordinates sequence and readiness with each trade and OEM.
  • Commissioning duration is scoped per project from I/O count, number of sequences, and the outage plan. One week on-site is typical for a single-panel system — an estimate confirmed in the proposal, not a fixed allowance.
  • Customer-requested additional testing, contractor delays, or site time beyond the agreed scope are handled as pre-priced additional days, approved before they are worked.
HW SW On-site · scoped per project
Data

Data Historian Integration

Standalone or add-on to any package
PACKAGE E

A live, trending record of your existing system — without touching the underlying controls.
  • Compatibility review of your controllers, network, and servers.
  • Time-series database (InfluxDB) with Grafana dashboards, on-premises or hosted as agreed.
  • Read-only by design: the historian collects and displays; control stays in the PLC and HMI.
  • Continues as a managed service — see Managed Historian Services ↓
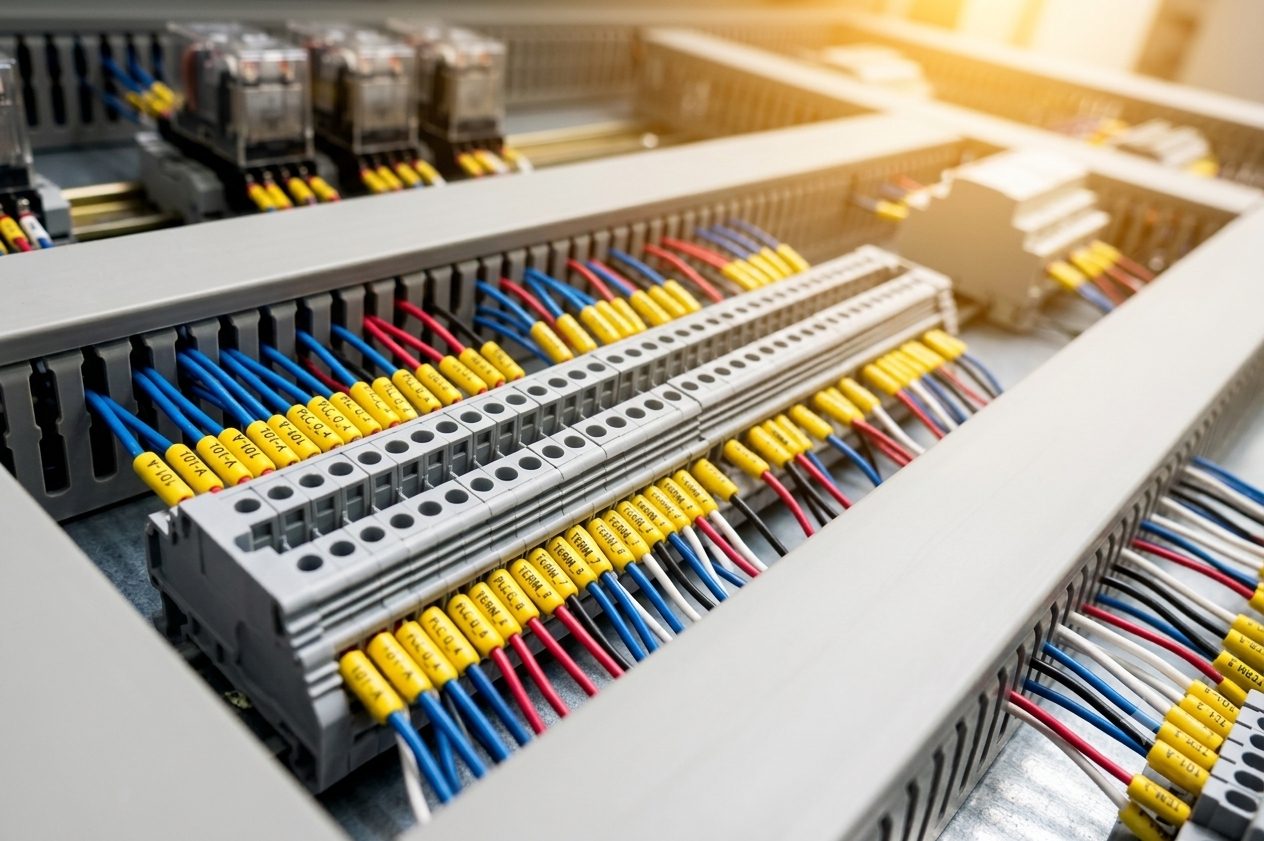
Close-up of professionally wired terminal blocks
Sensor to dashboard · Accountable end to end

The level of system and performance visibility your site needs to run efficiently.

A managed historian — database server, dashboards, alarm notifications, and license management — supported by the firm that integrated it. Sold as a managed service with defined scope, retention, and ownership terms.

After a compatibility review of your controllers, network, and servers, Russell Controls integrates an InfluxDB time-series database with Grafana dashboards and supports it as an ongoing service — on new builds, or on existing systems that need nothing more than a modern monitoring layer.
Included in every package
  • Data collection from PLCs and gateways
  • Dashboards and trending
  • Threshold alarm notifications (email / SMS)
  • Scheduled reports
Not part of a historian
  • Supervisory control — stays in the PLC and HMI
  • Predictive analysis beyond trend and threshold rules — separate engineering, on request
[ TAGS ]Tags are sold in packages, never per data point, so adding instrumentation is never penalized. Outgrow a package and you move up to the next one.
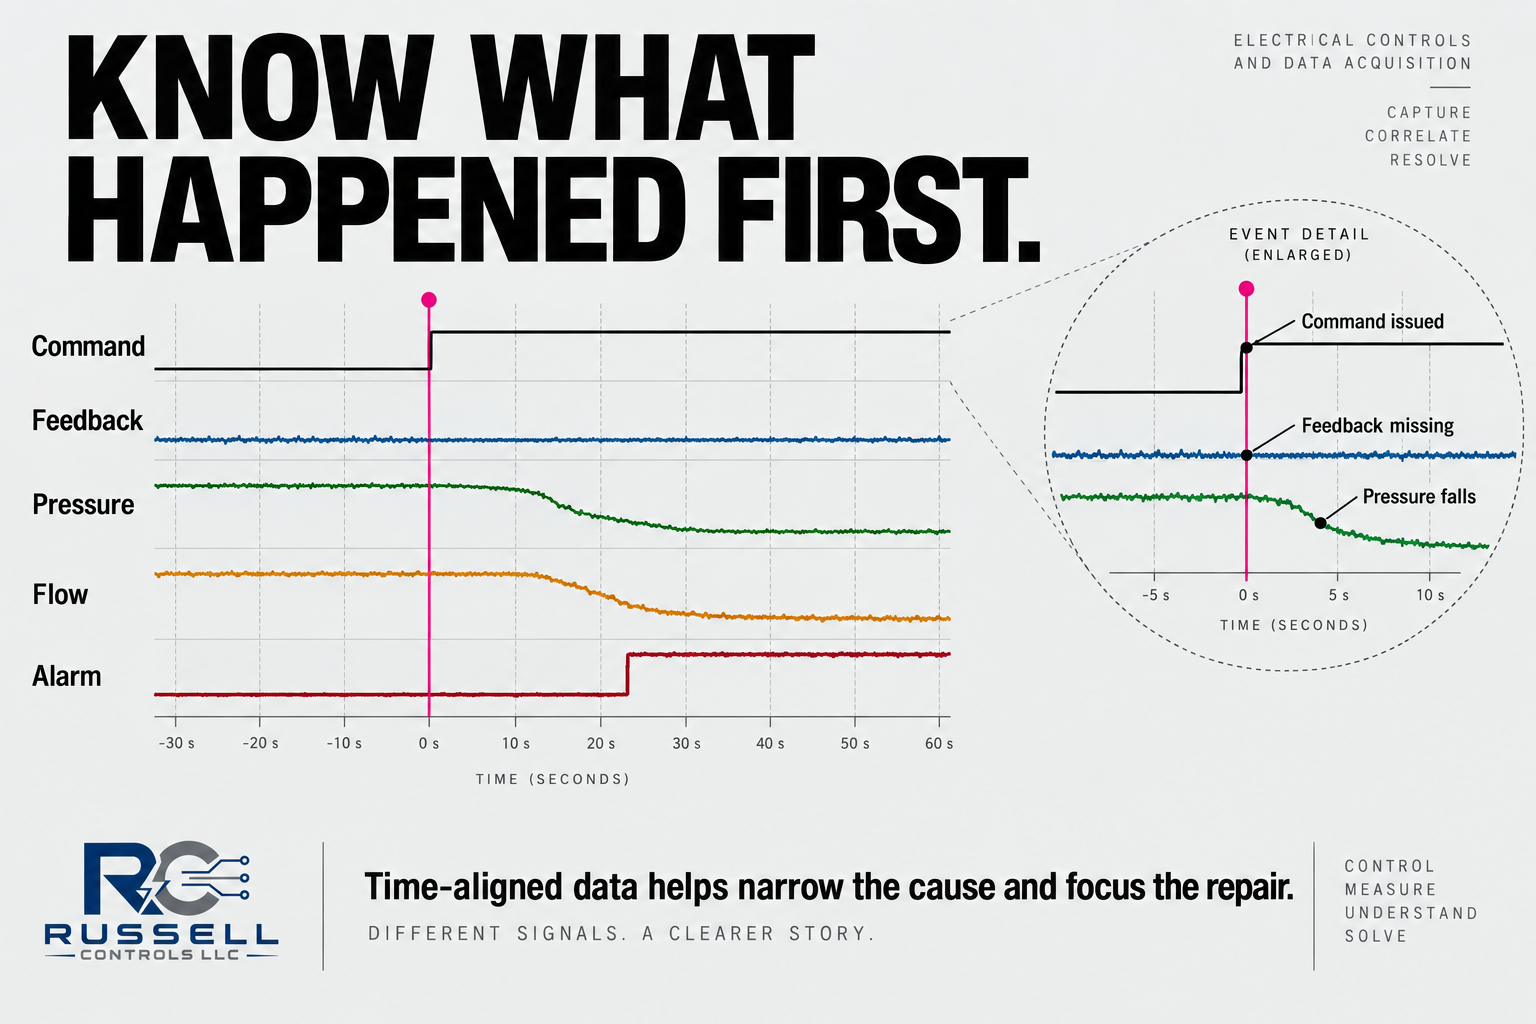
Know what happened first — command, feedback, pressure, flow and alarm signals time-aligned around one event
Fig. 01 — One event, five signals, time-alignedRussell Controls
Edge
Up to 250 tags
One machine, skid, generator set, or small utility site — one critical asset under continuous watch.
Site
Up to 1,000 tags
A single facility or production line — trending, alarms, and history in one place.
Plant
Up to 5,000 tags
A multi-line plant with scheduled reporting and alarm escalation across teams and shifts.
Enterprise
Up to 20,000 tags
Multi-site operations consolidated under one view, with the longest retention tier.
Regulated / On-Prem
Tag count scoped
Fully self-hosted for DoD, CUI, and other restricted environments. Remote access only with written customer approval, through the customer’s approved method; support without remote connectivity via scheduled site visits.
Retention, storage & backups

Retention, storage, and backup requirements are defined for each package and documented in the service agreement: the full-resolution retention period, storage capacity sized to tag count and sampling rate, and backup frequency and location.

Ownership & exit

The customer owns all collected data. At termination, a full export (CSV or InfluxDB line protocol) and the dashboard definitions are delivered at no charge, and hosted copies are deleted on written confirmation.

Regulated deployments

On-premises hosting supports your compliance program but does not by itself establish CMMC or other compliance — that remains the system owner’s program. Remote access is never enabled without the customer’s written approval.

// Pricing per package is shared during your consultation — scoped to deployment, retention, and support level. Detailed package terms are available on request.

Published research describes what predictive-maintenance programs achieve when trend data is collected, analyzed, and acted on by maintenance staff. A historian provides the measurements; the savings come from the analysis and the maintenance actions that follow. The figures below are industry context — not guaranteed results of a historian installation.
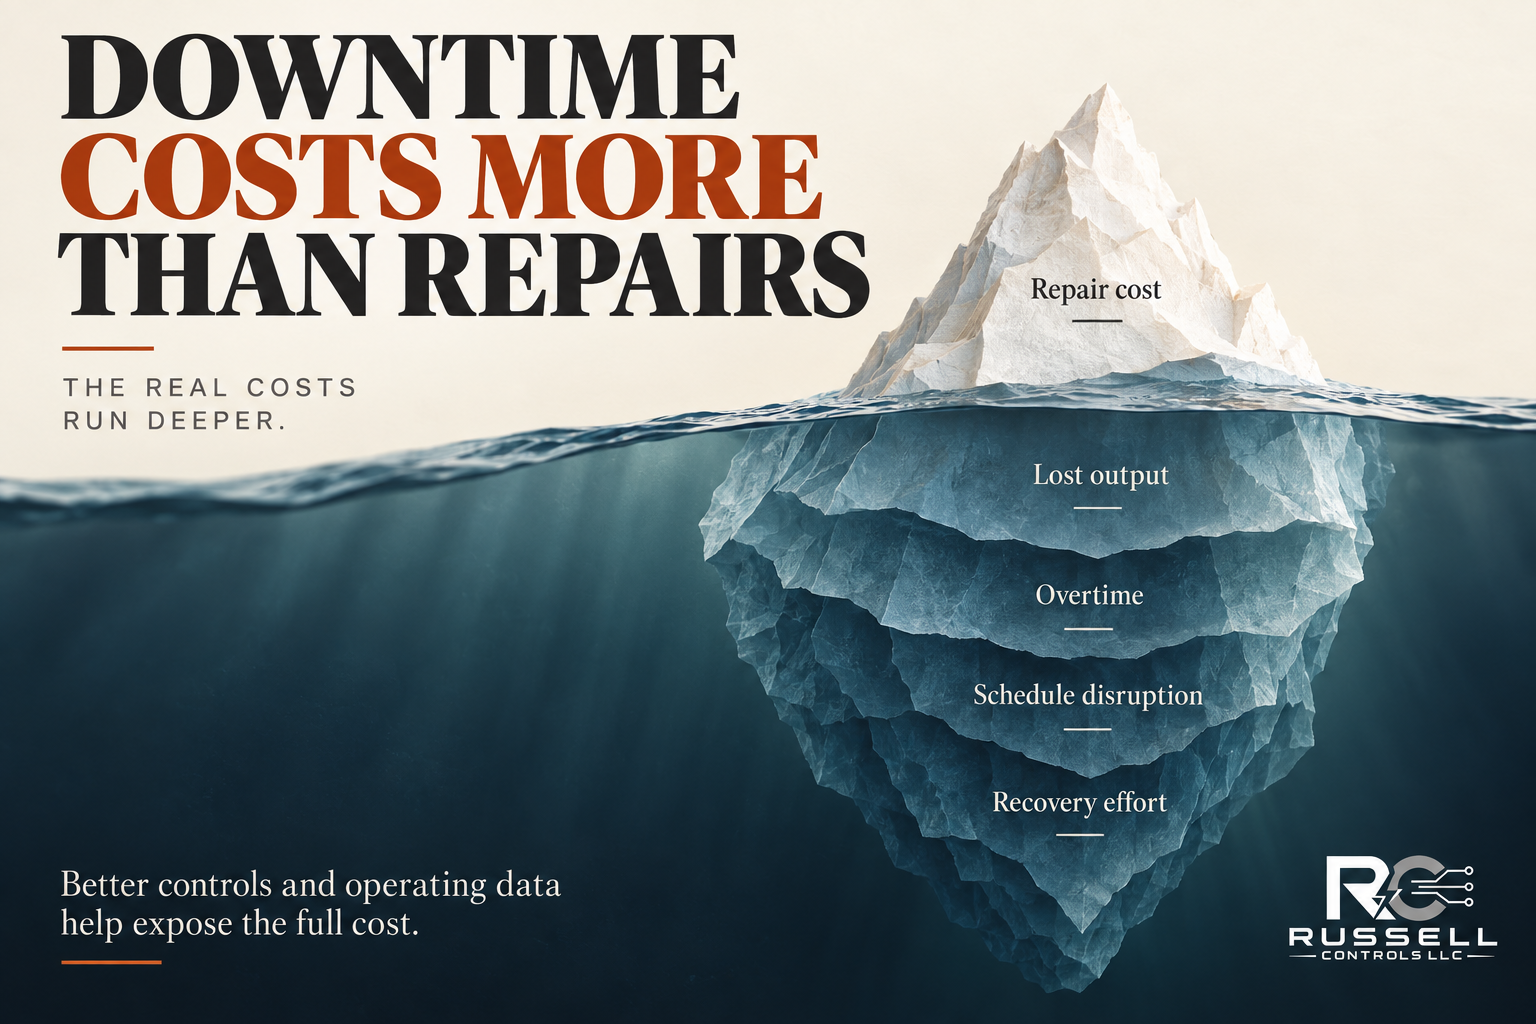
Downtime costs more than repairs — repair cost above the waterline; lost output, overtime, schedule disruption and recovery effort below it
Fig. 02 — The full cost of an unplanned stopRussell Controls
~$1.5T
Estimated annual cost of unplanned downtime to the Fortune Global 500 — roughly 11% of yearly turnover.
Siemens / Senseye, 2022
30–40%
Maintenance savings a predictive program can deliver over a purely reactive, run-to-failure approach.
U.S. DOE O&M Best Practices Guide
10–20%
Increase in equipment uptime and availability reported with predictive maintenance enabled by condition data.
Deloitte
#1
Equipment failure is the single largest cause of unplanned downtime — the failures trended data sees coming first.
Plant Engineering, Maintenance Study

What changes for your maintenance team

Activity
Without trended data
With a historian
Fault detection
A developing fault is visible only when someone is watching the right gauge at the right moment.
Trends on temperature, vibration, current, and runtime show degradation days or weeks early — and alarm on it.
Maintenance planning
Calendar-based PMs and run-to-failure — the team either over-services or gets caught short.
Condition-based: the team schedules service on the actual state of the asset, in planned windows.
Troubleshooting
Diagnosis relies on what your technicians can observe after the trip — troubleshooting is a scrambled response.
Your technicians replay the exact sequence before the trip and identify root cause — troubleshooting is organized and concise.
System knowledge
Knowledge leaves when senior personnel leave. Shift changes can often miss key information.
That experience is written into a searchable record the whole team can query. Shift personnel have enhanced awareness of system operations.
// Source notes — industry figures

Siemens / Senseye, The True Cost of Downtime (2022). Unplanned downtime costs the Fortune Global 500 an estimated 11% of yearly turnover — on the order of $1.5 trillion annually.

U.S. Department of Energy, Operations & Maintenance Best Practices Guide. A functional predictive-maintenance program can yield savings of roughly 30–40% over a reactive approach.

Deloitte, predictive maintenance / smart-factory analyses. Associates predictive maintenance with roughly a 10–20% increase in equipment uptime and availability.

Plant Engineering, Maintenance Study. Identifies aging equipment and equipment failure as the leading cause of unplanned downtime.

Figures are public industry estimates that vary widely by sector, asset, and plant. They depend on the measurements being analyzed and acted on, and are presented as context — not as guaranteed results for any facility or historian installation. Expected benefits for your system are scoped during a consultation.